

A precinct-by-precinct examination of South Carolina’s Republican Senate runoff shows that Ralph Norman’s vote total grew more between rounds and that most new turnout came from Trump territory — even as Darline Graham performed substantially better in precincts Kamala Harris carried in 2024.
The statewide result of South Carolina’s August Republican U.S. Senate runoff seemed simple enough.
Darline Graham won.
She finished with 193,486 votes to Ralph Norman’s 175,412, an 18,074-vote margin that gave her 52.45 percent of the runoff vote.
But the statewide total hides a considerably more complicated election.
A WriteInRalph.com analysis of precinct-level election results from all 46 South Carolina counties — comparing the August 11 Republican primary, the August 25 runoff and the 2024 presidential election — found several patterns moving in different directions at the same time.
Norman’s vote total grew more than Graham’s between the first round and runoff.
The overwhelming majority of the actual increase in turnout came from precincts Donald Trump carried in 2024.
Yet Graham performed better against Norman in precincts that had voted for Kamala Harris.
And in the most heavily Republican precincts in the state, Norman finally overtook Graham in the aggregate vote.
Those facts do not neatly fit into one explanation. But together, they provide a more detailed picture of how a compressed, heavily funded and unusually high-profile Republican runoff actually unfolded.
Norman’s vote grew more, even though Graham won
The first distinction is important.
Graham received 109,881 votes in the August 11 primary. Norman received 82,627.
Two weeks later, Graham finished with 193,486 and Norman with 175,412.
That means Graham’s vote total grew by 83,605 votes between rounds.
Norman’s grew by 92,785.
Norman therefore added approximately 9,180 more votes to his total than Graham did between the primary and runoff.
That happened despite Graham entering the runoff with formidable institutional support.
President Donald Trump endorsed Graham and traveled to Myrtle Beach days before the runoff to campaign for her. Third-place finisher U.S. Rep. Russell Fry endorsed her, as did Gov. Henry McMaster and U.S. Sen. Tim Scott.
The financial environment was similarly lopsided.
According to an SC Daily Gazette review of Federal Election Commission filings, outside groups spent at least $5 million supporting Graham and $4.9 million opposing Norman. Norman benefited from roughly $517,000 in outside support, while groups spent about $392,000 opposing Graham.
That makes Norman’s larger growth between rounds notable.
But it does not mean Norman found 92,785 entirely new voters, just as Graham did not find 83,605 entirely new voters.
The reason becomes obvious when looking at total turnout.
The runoff electorate grew by 33k
The August 11 primary drew 335,693 ballots statewide.
The August 25 runoff drew 369,190.
That is an increase of 33,497 ballots, or just under 10 percent.
Meanwhile, Graham and Norman’s combined vote totals increased by far more than that.
The explanation is straightforward: more than 140,000 voters in the first round had supported candidates who did not advance. If those voters returned for the runoff, they had to choose between Graham and Norman.
So increases in the candidates’ individual vote totals mostly reflect a reshuffling and consolidation of the first-round electorate, mixed with a smaller pool of additional runoff voters.
That distinction matters because it changes the question.
Instead of asking which candidate “gained” the most voters, the more revealing question is:
Where did the additional 33,497 ballots actually come from?
The precinct data gives a striking answer.
The turnout surge came overwhelmingly from Trump territory
We matched 2026 precinct results against how those precincts voted in the 2024 presidential election.
Among 700 directly comparable precincts carried by Harris in 2024, turnout increased from:
39,504 ballots on August 11
to
42,364 on August 25.
That is a net increase of 2,860 ballots, or approximately 7.2 percent.
In directly comparable precincts carried by Trump, turnout climbed from:
294,706
to
325,171.
That is a gain of 30,465 ballots, or approximately 10.3 percent.
Put another way, among the statewide turnout increase that could be directly matched to 2024 presidential geography, roughly:
8.5 percent came from Harris-won precincts.
91 percent came from Trump-won precincts.
The turnout surge was not concentrated in blue precincts.
It was overwhelmingly a red-precinct phenomenon.
And the deeper into Republican territory the analysis goes, the clearer the pattern becomes.
The deepest-red precincts produced the biggest gains
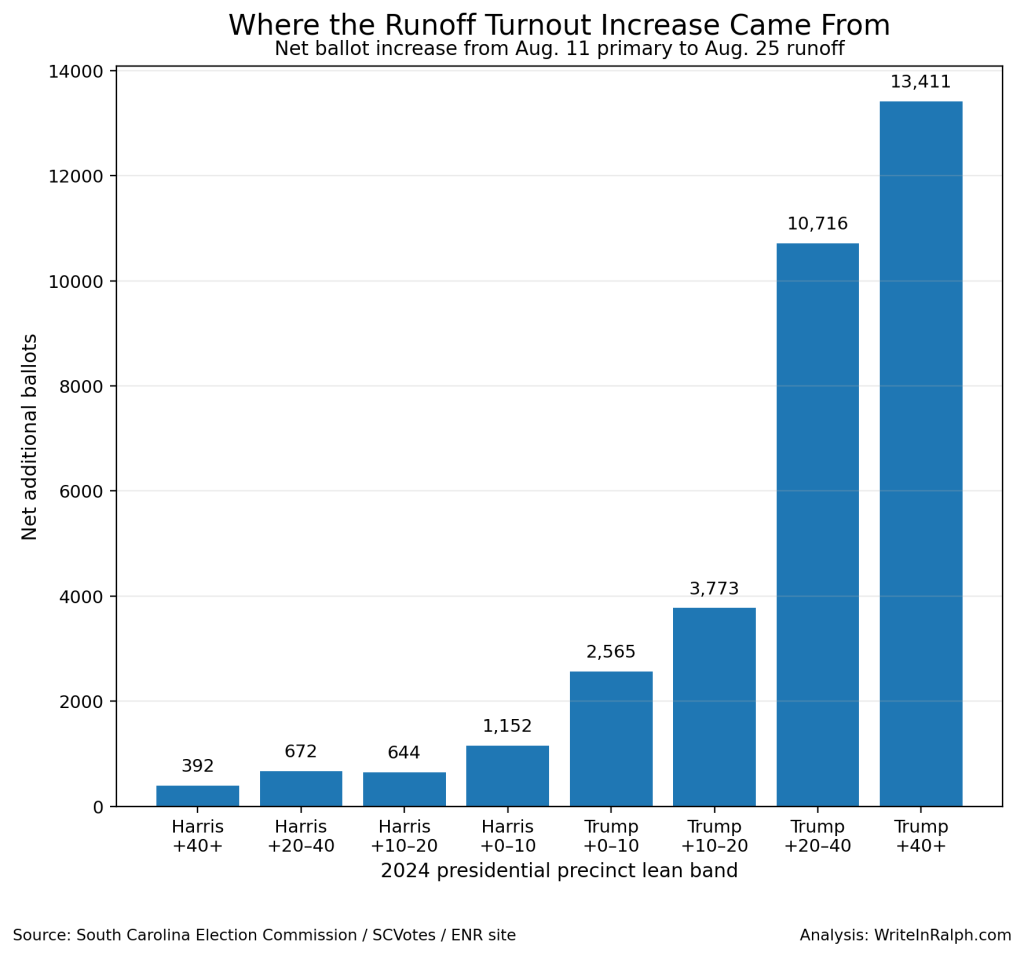
Precincts Harris carried by more than 40 points added just 392 ballots between the primary and runoff.
Harris +20 to +40 precincts added 672.
Harris +10 to +20 precincts added 644.
Harris +0 to +10 precincts added 1,152.
Then the numbers began climbing.
Trump +0 to +10 precincts added 2,565.
Trump +10 to +20 added 3,773.
Trump +20 to +40 added 10,716.
And precincts Trump carried by more than 40 points added 13,411 ballots.
Those final two categories alone produced 24,127 additional ballots.
That is roughly 72 percent of the entire statewide primary-to-runoff turnout increase.
The pattern was not limited to raw vote totals.
Among comparable Harris-won precincts, about 63 percent experienced an increase in turnout.
Among comparable Trump-won precincts, roughly 82 percent did.
Whatever mobilized additional Republican runoff voters, it was much more widespread and much larger in precincts that had already demonstrated a strong Republican lean in the previous general election.
Graham did better in the blue precincts that did participate
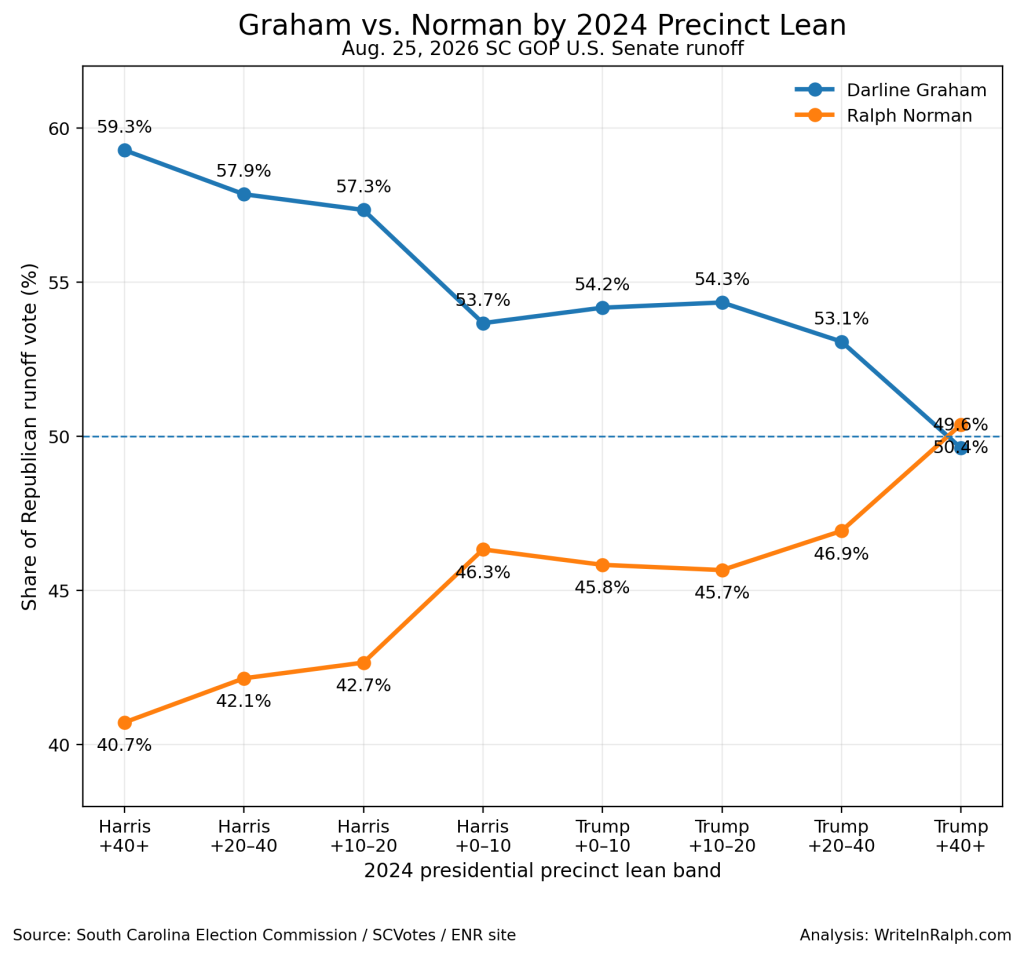
Although Democratic-leaning precincts accounted for only a small share of the turnout increase, Graham consistently performed better against Norman in those areas.
Among precincts Harris carried by more than 40 points in 2024:
Graham received 59.3 percent.
Norman received 40.7 percent.
In Harris +20 to +40 precincts:
Graham: 57.9 percent
Norman: 42.1 percent
In Harris +10 to +20:
Graham: 57.3 percent
Norman: 42.7 percent
And in the narrowest Harris precincts:
Graham: 53.7 percent
Norman: 46.3 percent
The pattern changed as the map became more Republican.
Graham still narrowly led in the middle Republican categories, but her advantage steadily weakened.
Then, in precincts Trump carried by more than 40 percentage points, the aggregate result flipped:
Norman: 50.4 percent
Graham: 49.6 percent
The contrast between the deepest-blue and deepest-red categories amounts to almost a 10-point swing in Graham’s share of the vote.
The broad pattern is difficult to miss:
Graham’s relative performance was strongest in more Democratic geography. Norman’s relative performance became strongest in South Carolina’s deepest Republican precincts.
That is especially notable considering how central Trump’s endorsement became to Graham’s runoff campaign.
Trump did more than issue a statement. He traveled to Myrtle Beach and campaigned for her publicly shortly before the election, telling supporters he had urged Graham to enter the race.
Yet Norman ultimately performed best, relative to Graham, in the places where Trump himself had been strongest on the ballot two years earlier.
That does not prove those voters rejected Trump’s endorsement. Voters choose candidates for many reasons, and precinct geography is not a direct measurement of individual motivation.
But it is a highly notable contrast.
Graham carried more than two-thirds of Harris-won precincts
The precinct-win count tells the same story from another angle.
Of 700 directly comparable precincts Harris carried in 2024:
Graham carried 480.
Norman carried 186.
Thirty-four were tied.
One additional Harris-won precinct could not be directly compared because its boundaries were consolidated before the 2026 election.
So among directly comparable Harris precincts, Graham carried roughly 69 percent.
That is not “nearly all” of them.
But it is a substantial majority.
More important than the precinct count is what happened when those votes were added together.
Across comparable Harris-won precincts:
Graham received 23,847 votes.
Norman received 18,470.
That gave Graham a 5,377-vote advantage inside precincts that had favored Harris in 2024.
Graham won statewide by 18,074.
Her net advantage in Harris-won precincts was therefore equal to roughly 29.8 percent of her final statewide margin.
In an election decided by fewer than 20,000 votes statewide, a 5,377-vote advantage in a relatively small geographic slice of the electorate is not trivial.
Does this prove Democratic crossover?
Not exactly.
Voters who participated in the June Democratic primary or runoff were not eligible to participate in the August Republican special primary and runoff. Voters who participated in the June Republican primary, or who had not participated in either party’s June primary, could be eligible.
So it is possible that some general-election Democratic voters, held in reserve, participated in August.
The precinct totals cannot tell us how many.
Individual voter-history data would be needed to answer that question.
What the numbers do establish is still significant:
Runoff voters living in precincts that had supported Harris were considerably more favorable to Graham than Republican runoff voters living in South Carolina’s most heavily Republican precincts.
Two seemingly conflicting stories can both be true
At first glance, the turnout and candidate-performance findings may seem contradictory.
They are not.
The turnout surge came overwhelmingly from Republican precincts.
At the same time:
Graham performed relatively better in Democratic precincts.
One finding measures where the additional ballots appeared.
The other measures how Graham and Norman divided the Republican runoff electorate once those ballots were cast.
The distinction is important.
The data does not show blue precincts flooding the Republican runoff and overwhelming red precincts.
In fact, the opposite happened on turnout: Trump precincts produced the overwhelming majority of the increase.
But within the relatively small group of Republican runoff voters living in Harris-won territory, Graham built a measurable advantage.
And at the deepest Republican end of the spectrum, Norman became stronger.
Money, endorsements and geography did not move in perfect alignment
The election also demonstrates the limits of assuming endorsements, spending and ideological geography will all point in the same direction.
Graham had Trump.
She had McMaster.
She had Scott.
She had Fry after Fry finished third in the first round.
She also benefited from millions of dollars in outside spending, while Norman faced millions in expenditures opposing him.
Graham won.
But underneath that victory, Norman’s raw vote total still grew by more between rounds.
The deepest-red precincts produced the largest turnout increases.
And the most heavily Trump-supporting precincts were the one major category where Norman edged Graham in the aggregate vote.
Meanwhile, Graham’s strongest relative numbers appeared in precincts that had been the least supportive of Trump in 2024.
What the statewide total did not show
The final tally tells South Carolinian's who won.
The precinct data tells them how complicated the winning coalition was.
Most of the new turnout came from Republican territory.
Norman gained more votes between rounds.
Graham nevertheless maintained enough support across the state to finish ahead.
To no surprise she performed particularly well among "Republican" runoff voters living in Democratic-leaning precincts.
And although those precincts were a relatively small part of the electorate, the advantage she accumulated there amounted to nearly 30 percent of her eventual statewide margin.
None of that proves that Democratic crossover voters handed Graham the nomination.
Nor does it prove that Trump’s endorsement failed.
It does show that presidential endorsements, outside spending, geographic ideology and runoff turnout did not move together in a simple straight line.
South Carolina’s August runoff contained multiple electorates inside one election.
The deeper the data goes, the harder it becomes to describe Graham’s victory as merely a statewide 52-to-48 result.
The more revealing story may be the coalition underneath it.
Methodology
Analysis by WriteInRalph.com using South Carolina Election Commission / SCVotes / ENR data.
The analysis compared precinct-level results from all 46 South Carolina counties in the August 11, 2026 Republican U.S. Senate special primary and the August 25 runoff with South Carolina Election Commission precinct results from the 2024 presidential election.
Precincts were grouped according to whether Kamala Harris or Donald Trump carried them in 2024 and by the size of the presidential margin.
A small number of precincts could not be directly compared because boundaries or precinct configurations changed between 2024 and 2026. Those precincts were not assigned to a presidential category where a reliable one-to-one comparison could not be made.
Precinct-level election results describe geographic voting patterns. They do not identify the previous presidential preference or party affiliation of individual runoff voters.